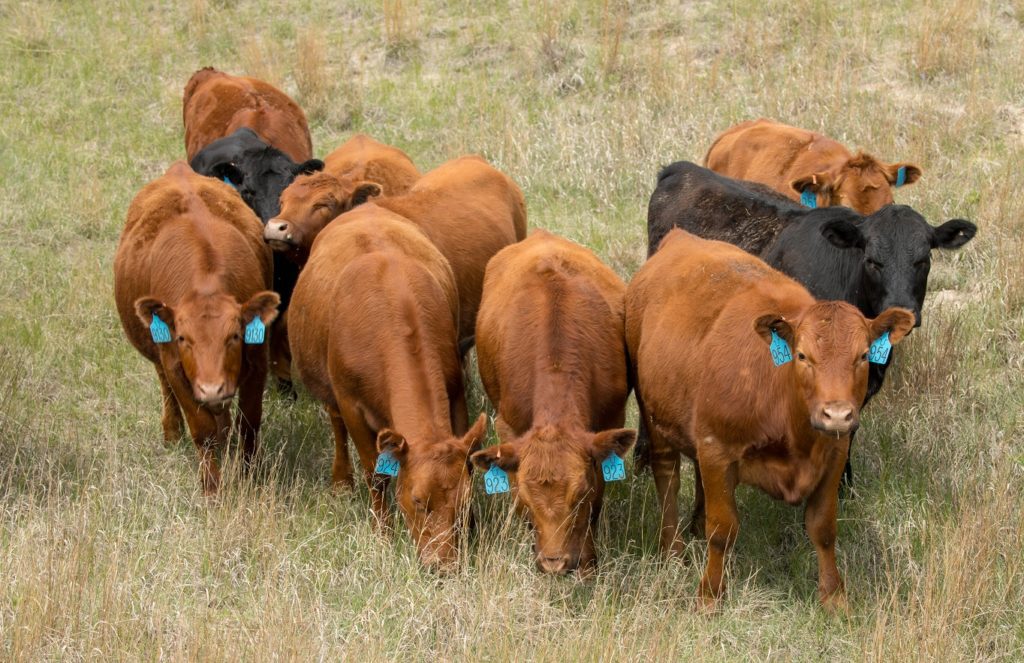
When raising or purchasing replacement heifers, each heifer’s value is based on her ability to stay in the herd and the producer’s ability to manage that productivity, control costs and use the market to their advantage.
What is a respectable beef replacement heifer value for the coming 2020-2021 production season? The weather and COVID-19 gave the beef industry a wild ride this past year and may affect the decision to buy or sell replacement animals for the upcoming year.
This is the fourth year the authors have forecasted replacement heifer values to provide producers with more information regarding this decision. The replacement heifer forecast uses forecasted price and costs scenarios created by the University of Missouri Food and Agriculture Policy Research Institute (FAPRI) 10-year projections as a starting point. The FAPRI scenarios are then modified to better fit Nebraska producers.
Selecting replacement heifers differs from ranch to ranch, but four factors affect the value for both retained and purchased replacements:
- Longevity – the replacement heifer’s ability to stay in the herd as a productive unit
- Costs vs Value – both current and future expected difference between costs and revenues (calf price and costs differences over the heifer’s productive life)
- Genetic and phenotypical compatibility with herd mates
- Operator goals and management style
This forecast assumes producers know two things about their operation:
- Annual cost of production per cow. UNL’s Cow Cost CowQLator can help calculate this.
- Replacement rate. This the number of heifers needed each year to replace culled cows.
Annual cost of production in this forecast does not include replacement costs, depreciation, or death loss and does not represent cost per calf. Three annual production costs per animal were identified for the initial 2020-2021 calving season and adjusted to reflect the forecasts made by FAPRI. The three annual costs of production per cow used in this forecast were $716.16 (LO), $780.50 (AVE), and $831.20 (HI). Cost levels relate directly to reported summer pasture rental rates of the region (North Central Nebraska), ranging from a low of $51.51/cow-calf pair to a high of $69.31/cow-calf pair with an average rental fee of $61.45/cow-calf pair (2020 Nebraska Ag Real Estate Report).
FAPRI forecasts both production costs and prices for cattle for each of the ten years listed in their report. As indicated, these costs were used to create an index to adjust the three initial cost levels to the appropriate year in the forecasting model.
Since it is difficult to anticipate and quantify all the possible conditions, types and choices that might occur, three levels of cost of production and three herd cost types were used to create a total of nine different breakeven value forecasts. The resulting nine forecasts are the product of 1000 possible outcomes from probable price and production variations. Outcomes will vary by producer depending on unique circumstances, level of productivity, genetic differences, management styles and available resources. Results are reported in the following ways:
1) As forecast average breakeven value (Figure 1)
2) Change in Asset/Replacement (Figure 2) Changes in (current assets) where replacements on average cost $1,100. It was assumed replacements were purchased with cash. Therefore, the change in asset value over the life of the cow represents either a loss or gain in net worth to the beef operation.
3) Dollar change for each 1% change in replacement rate Table 1
4) Dollar change for each $1 change in production costs Table 2
5) Probability of cow paying off her purchase price above $1,100

A herd with a replacement rate of 14% and a LO cost is forecasted to breakeven if they paid as much as $2,128.23. for a replacement heifer. The 28% replacement rate and HI cost herd is forecasted to breakeven at $1,036.24. Higher replacement rates and higher production costs result in lower breakeven values. Cow longevity increases replacement breakeven values. This is inversely true of costs, with higher production costs resulting in lower breakeven values.
The average change in current assets per cow purchased forecast are listed by LO, AVE and HI production costs and 14, 20 and 28% replacement rate in Figure 2. These forecasts show a positive increase per cow, except for the 28% replacement rate and HI cost. Please note this is an average outcome. For example, LO cost 14% replacement rate cows culled after their first calf on average had a negative net change in assets of $355.90/cow. Whereas in the same scenario, culled 12-year-old cows had a positive average net asset gain of $3,169.02/cow. The reason these gains are so positive are directly related to relatively low purchase price verses the forecasted breakeven price. In LO cost 14% rate and replacement costs of $1,100/heifer the 12-year old cows had an average net asset gain of $3,022.21/cow. Another reason for the large breakeven values is the FAPRI forecast are optimistic about cattle prices. For example, FAPRI forecasts 2021 feeder cattle prices to be $3.15/cwt higher than the 2020 price and to climb an additional $5.56/cwt compared to 2022. Last year’s forecasts were much different as they forecasted 2020 feeder cattle price would be $5.68/cwt lower than 2019, and that 2021 price would continue to fall and be another $9.38/cwt lower than the 2020 price. These forecasts affect payback for two reasons, the time value of money and the odds of being culled.

When you combine the information from Figure 1 and Figure 2, and calculate the differences created by changing cost or replacement rate the resulting information found in Tables 1 and 2, provides the needed information to identify replacement cow values at varying costs and replacement rates Table 1 shows the effect of replacement rate variations on replacement cow value, in terms of each % increase or decrease depending on the direction of the change. Table 2 shows the reciprocal effect of production cost changes by replacement rate category, that is the change in replacement cow value for everyone dollar increase or decrease in costs depending on the costs level.

Table 1 shows the difference in heifer value in Figure 1 between 14% and 20% replacement rate and between 20% and 28% replacement rate. For instance, a 17% replacement rate with the LO cost would result in a discount of $212.40/replacement heifer ($70.80 x (14%-17%)).

Table 2 shows the difference in heifer value in Figure 1 between LO, AVE and HI production cost at a 14, 20 and 28% replacement rate. If a producer has a production cost of $790.50/cow and a 14% replacement rate, using table 2 the extra cost would reduce replacement heifer break even by $63 ($780.50 -790.50) x $6.30).
Individual Cow Probabilities of Net Return

Costs and replacement differences alter the probability an individual cow will cover or exceed the amount paid for her purchase. This payback should include her cull value and death loss factors. By measuring the number of cows who successfully returned their purchase value and dividing it by the number of cows purchased and multiplying that number by 100 the probability of success is estimated. Figure 3 lists the probability of success for each cost and replacement rate. As expected, a production cost of $716.16/cow, and 14% replacement rate had the highest probability of payback with 76% of the cows at least returning their purchase costs. Whereas the $831.20/cow cost, 28% replacement rate only had a 36% probability of returning or exceeding their purchase costs. When purchasing replacement heifers, supply and demand control the price. Cow longevity and production costs are keys to ranch profitability and sustainability.
Conclusion
Increased productivity without altering costs or changing replacement rates will increase the amount that can be paid for replacement animals. Productivity changes can include calving rate and calf growth rate. Revenue changes created by cattle prices will also affect replacement heifer breakeven value. Higher prices lead to higher breakeven values, while lower ones lead to lower breakeven values. This last point may seem obvious, but remember it is complicated by a heifer’s productive life that can span a decade, and during this productive span prices vary. If calf prices trend higher over time and assuming costs are fixed, heifer breakeven value increases. An economically successful producer buys or raises replacement heifers for no more than what is needed in net returns over their lifetime.
The relationship between costs and replacement rate is not constant, making production and cost choices critical, when paying for replacement heifers. Please note even if producers are raising replacements, they are still paying for them. As longevity of heifer replacements increase, average herd age increases, and breakeven values increase, except in years when costs exceed revenue. Low cost, low replacement herds can afford higher valued replacement heifers and replace capital faster in their operations. When raising or purchasing replacement heifers, each heifer’s value is based on her ability to stay in the herd and the producer’s ability to manage that productivity, control costs and use the market to their advantage. Applying these principles is key to making an operation more profitable and resilient.
For more information please read the complete executive summary at https://farmcents.unl.edu/annual-beef-heifer-replacement-forecasts-2020-21.
Last year’s forecast is available at https://beef.unl.edu/beefwatch/2020/university-nebraska-lincoln-extension-beef-economics-team-annual-beef-heifer.
Source: UNL Institute of Agriculture & Natural Resources

